I Am Like Python and R But Not Quite
·
Mehmet Dogan
·
10 min read
A mini-funny Julia crash course for Python and R users
Hello, World! I’m Julia. I’m like Python and R but I have my personality.
You can run me online to follow this tutorial if you haven’t installed me already.
Printing
I can print everything using print() or println()
- print(): prints on the same line
- println(): adds a new line to the end of the output
println("Hello, I'm Julia")
## Hello, I'm Julia
println("I'm like like Python and R, but not quite")
## I'm like like Python and R, but not quite
Package management
Installing a package
I install new packages using:
- Pkg.add(“package_name”)
using Pkg
Pkg.add("DataFrames")
Adding a package to current session
I add packages to my current session via using keyword:
- using package_name
using DataFrames # similar to data.frame, data.table and dplyr in R, pandas in Python
using CSV # similar to read.csv, readr in R, pandas in Python
using Statistics # similar to base R, base Python
using Dates # similar to date in base R and datetime in python
using Plots # similar to base R plot, matplotlib in Python
using Gadfly # similar to ggplot2, not similar to anything in python - this was never achieved in Python
Vectors
I’m like python,
- but I can do element-wise calculations like R
- my syntax is a little bit strange in particularly when multiplying and dividing
- because I don’t want you to be wrong.
Creating a vector
first_vector = [1, 2, 3, 4, 5]
## 5-element Vector{Int64}:
##  1
##  2
##  3
##  4
##  5
second_vector= [10, 10, 10, 10, 10]
## 5-element Vector{Int64}:
##  10
##  10
##  10
##  10
##  10
Element-wise calculations
# Addition
first_vector + second_vector
## 5-element Vector{Int64}:
##  11
##  12
##  13
##  14
##  15
first_vector .+ second_vector # the same as above
## 5-element Vector{Int64}:
##  11
##  12
##  13
##  14
##  15
# Subtraction
first_vector - second_vector
## 5-element Vector{Int64}:
##  -9
##  -8
##  -7
##  -6
##  -5
first_vector .- second_vector
## 5-element Vector{Int64}:
##  -9
##  -8
##  -7
##  -6
##  -5
# Multiplication
first_vector .* second_vector
## 5-element Vector{Int64}:
##  10
##  20
##  30
##  40
##  50
# Division
first_vector ./ second_vector
## 5-element Vector{Float64}:
##  0.1
##  0.2
##  0.3
##  0.4
##  0.5
Slicing vectors
- My index starts from 0, just like R
- When slicing, I include last index value like R but unlike Python
my_vect = [1, 2, 3, 4, 5];

# Select the first element
my_vect[1]
## 1
my_vect[begin] # the same as above
## 1
# Select the first three elements
my_vect[1:3]
## 3-element Vector{Int64}:
##  1
##  2
##  3
# Select the last element
my_vect[end]
## 5
Control Flow
If statement
- I’m like Python but without :
- like R but w/o ugly { }s
- I must end with end
- Unlike Python I don’t need indentation but I prefer to have it.
if 5 > 0
    println("Print me")
elseif 10 > 0 # - I have elseif in the middle, just like R
    println("Print me instead")
else
    println("Better to print me")
end
## Print me
While loop
- I’m like Python but without :
- like R but w/o ugly { }s
- I must end with end
- Unlike Python I don’t need indentation but I prefer to have it
- If I want to access a global variable inside of me I set global variable_name.
x = 5;
while x > 0
    global x
    println("Print me $x")
    x -= 1
end
## Print me 5
## Print me 4
## Print me 3
## Print me 2
## Print me 1
For loop
- I’m like Python but without :
- like R but w/o ugly { }s
- I must end with end
- Unlike Python I don’t need indentation but I prefer to have it.
for i in 1:10
    print(i, ",")
end
## 1,2,3,4,5,6,7,8,9,10,
Functions
- I’m like Python but without :
- like R but w/o ugly { }s
- I must end with end
- Unlike Python I don’t need indentation but I prefer to have it.
function square_number(y)
    return y^2
end
## square_number (generic function with 1 method)
Calling a function
I’m just like R and Python
square_number(10)
## 100
I’m Awesome!
square_number.([1,2,3,4,5]) # it will square each number in the vector
## 5-element Vector{Int64}:
##   1
##   4
##   9
##  16
##  25
DataFrames
I’m like R and a bit of Python
df = DataFrame(Stock=["A", "B", "C", "D"], Price=1:4)
## 4×2 DataFrame
##  Row │ Stock   Price
##      │ String  Int64
## ─────┼───────────────
##    1 │ A           1
##    2 │ B           2
##    3 │ C           3
##    4 │ D           4
Slicing DataFrames
- My index starts from 0, just like R
- I include last index value when slicing like R but unlike Python
- I don’t need annoying loc and iloc
- and don’t complain about copying as in Python
df.Stock # all elements of Stock column
## 4-element Vector{String}:
##  "A"
##  "B"
##  "C"
##  "D"
df[:, "Stock"] # all rows of Stock column
## 4-element Vector{String}:
##  "A"
##  "B"
##  "C"
##  "D"
df[:, 2] # all rows of Price column
## 4-element Vector{Int64}:
##  1
##  2
##  3
##  4
df[1:3, :] # first 3 rows of each column
## 3×2 DataFrame
##  Row │ Stock   Price
##      │ String  Int64
## ─────┼───────────────
##    1 │ A           1
##    2 │ B           2
##    3 │ C           3
df[[begin, end], "Price"] # first and the last rows of Price column
## 2-element Vector{Int64}:
##  1
##  4
df[[1,3], 2] # the first and the third rows of Price (2nd) column
## 2-element Vector{Int64}:
##  1
##  3
# Another DataFrame
stockPrices = DataFrame(
    Date = ["2022-01-31","2022-02-28","2022-03-31","2022-04-30","2022-05-31","2022-06-30","2022-07-31","2022-08-31","2022-09-30","2022-10-31","2022-11-30","2022-12-31",
    "2022-01-31","2022-02-28","2022-03-31","2022-04-30","2022-05-31","2022-06-30","2022-07-31","2022-08-31","2022-09-30","2022-10-31","2022-11-30","2022-12-31"],
    Stock=["TSLA","TSLA","TSLA","TSLA","TSLA", "TSLA","TSLA","TSLA","TSLA","TSLA","TSLA","TSLA",
    "NFLX","NFLX","NFLX","NFLX","NFLX","NFLX","NFLX","NFLX","NFLX","NFLX","NFLX","NFLX"],
    Price=[312.24,290.14,359.2,290.25,252.75,224.47,297.15,275.61,265.25,227.54,194.7,121.82,
    427.14,394.52,374.59,190.36,197.44,174.87,224.9,223.56,235.44,291.88,305.53,291.12]
)
## 24×3 DataFrame
##  Row │ Date        Stock   Price
##      │ String      String  Float64
## ─────┼─────────────────────────────
##    1 │ 2022-01-31  TSLA     312.24
##    2 │ 2022-02-28  TSLA     290.14
##    3 │ 2022-03-31  TSLA     359.2
##    4 │ 2022-04-30  TSLA     290.25
##    5 │ 2022-05-31  TSLA     252.75
##    6 │ 2022-06-30  TSLA     224.47
##    7 │ 2022-07-31  TSLA     297.15
##    8 │ 2022-08-31  TSLA     275.61
##   ⋮  │     ⋮         ⋮        ⋮
##   18 │ 2022-06-30  NFLX     174.87
##   19 │ 2022-07-31  NFLX     224.9
##   20 │ 2022-08-31  NFLX     223.56
##   21 │ 2022-09-30  NFLX     235.44
##   22 │ 2022-10-31  NFLX     291.88
##   23 │ 2022-11-30  NFLX     305.53
##   24 │ 2022-12-31  NFLX     291.12
##                      9 rows omitted
Converting a String column to Date
I have my own syntax.
stockPrices.Date = Date.(stockPrices.Date, "yyyy-mm-dd")
## 24-element Vector{Date}:
##  2022-01-31
##  2022-02-28
##  2022-03-31
##  2022-04-30
##  2022-05-31
##  2022-06-30
##  2022-07-31
##  2022-08-31
##  2022-09-30
##  2022-10-31
##  ⋮
##  2022-04-30
##  2022-05-31
##  2022-06-30
##  2022-07-31
##  2022-08-31
##  2022-09-30
##  2022-10-31
##  2022-11-30
##  2022-12-31
Displaying first n and last n elements
### Frist 5 elements - I'm like R and Python but "first" instead of "head"
first(stockPrices, 5)
## 5×3 DataFrame
##  Row │ Date        Stock   Price
##      │ Date        String  Float64
## ─────┼─────────────────────────────
##    1 │ 2022-01-31  TSLA     312.24
##    2 │ 2022-02-28  TSLA     290.14
##    3 │ 2022-03-31  TSLA     359.2
##    4 │ 2022-04-30  TSLA     290.25
##    5 │ 2022-05-31  TSLA     252.75
### Last 5 elements - I'm like R and Python but "last" instead of "tail"
last(stockPrices, 5)
## 5×3 DataFrame
##  Row │ Date        Stock   Price
##      │ Date        String  Float64
## ─────┼─────────────────────────────
##    1 │ 2022-08-31  NFLX     223.56
##    2 │ 2022-09-30  NFLX     235.44
##    3 │ 2022-10-31  NFLX     291.88
##    4 │ 2022-11-30  NFLX     305.53
##    5 │ 2022-12-31  NFLX     291.12
Group by and combine
I have my own syntax for groupby.
- I’m first grouping by
- then combining
grp = groupby(stockPrices, :Stock)
## GroupedDataFrame with 2 groups based on key: Stock
## First Group (12 rows): Stock = "TSLA"
##  Row │ Date        Stock   Price
##      │ Date        String  Float64
## ─────┼─────────────────────────────
##    1 │ 2022-01-31  TSLA     312.24
##    2 │ 2022-02-28  TSLA     290.14
##   ⋮  │     ⋮         ⋮        ⋮
##   11 │ 2022-11-30  TSLA     194.7
##   12 │ 2022-12-31  TSLA     121.82
##                      8 rows omitted
## ⋮
## Last Group (12 rows): Stock = "NFLX"
##  Row │ Date        Stock   Price
##      │ Date        String  Float64
## ─────┼─────────────────────────────
##    1 │ 2022-01-31  NFLX     427.14
##    2 │ 2022-02-28  NFLX     394.52
##   ⋮  │     ⋮         ⋮        ⋮
##   12 │ 2022-12-31  NFLX     291.12
##                      9 rows omitted
avg_prices = combine(grp, :Price => mean)
## 2×2 DataFrame
##  Row │ Stock   Price_mean
##      │ String  Float64
## ─────┼────────────────────
##    1 │ TSLA       259.26
##    2 │ NFLX       277.613
Filtering
- I’m way better than Python,
- but slightly uglier than R
filter(row -> row.Stock == "NFLX", stockPrices) # filter values for Netflix
## 12×3 DataFrame
##  Row │ Date        Stock   Price
##      │ Date        String  Float64
## ─────┼─────────────────────────────
##    1 │ 2022-01-31  NFLX     427.14
##    2 │ 2022-02-28  NFLX     394.52
##    3 │ 2022-03-31  NFLX     374.59
##    4 │ 2022-04-30  NFLX     190.36
##    5 │ 2022-05-31  NFLX     197.44
##    6 │ 2022-06-30  NFLX     174.87
##    7 │ 2022-07-31  NFLX     224.9
##    8 │ 2022-08-31  NFLX     223.56
##    9 │ 2022-09-30  NFLX     235.44
##   10 │ 2022-10-31  NFLX     291.88
##   11 │ 2022-11-30  NFLX     305.53
##   12 │ 2022-12-31  NFLX     291.12
# you can use any name in place of row
filter(DonaldTrump -> DonaldTrump.Stock == "NFLX", stockPrices) # I will be gladly working as well
## 12×3 DataFrame
##  Row │ Date        Stock   Price
##      │ Date        String  Float64
## ─────┼─────────────────────────────
##    1 │ 2022-01-31  NFLX     427.14
##    2 │ 2022-02-28  NFLX     394.52
##    3 │ 2022-03-31  NFLX     374.59
##    4 │ 2022-04-30  NFLX     190.36
##    5 │ 2022-05-31  NFLX     197.44
##    6 │ 2022-06-30  NFLX     174.87
##    7 │ 2022-07-31  NFLX     224.9
##    8 │ 2022-08-31  NFLX     223.56
##    9 │ 2022-09-30  NFLX     235.44
##   10 │ 2022-10-31  NFLX     291.88
##   11 │ 2022-11-30  NFLX     305.53
##   12 │ 2022-12-31  NFLX     291.12
Importing and exporting data
Writing a DataFrame to csv
I’m like R and Python but I have my own syntax.
- I first accept filename.csv
- and then DataFrame name
CSV.write("stockPrices.csv", stockPrices)
## "stockPrices.csv"
Reading data from csv as DataFrame
I am neither Python nor R.
- First import me
- and then hug me with DataFrame()
stockPrices = DataFrame(CSV.File("stockPrices.csv"))
## 24×3 DataFrame
##  Row │ Date        Stock    Price
##      │ Date        String7  Float64
## ─────┼──────────────────────────────
##    1 │ 2022-01-31  TSLA      312.24
##    2 │ 2022-02-28  TSLA      290.14
##    3 │ 2022-03-31  TSLA      359.2
##    4 │ 2022-04-30  TSLA      290.25
##    5 │ 2022-05-31  TSLA      252.75
##    6 │ 2022-06-30  TSLA      224.47
##    7 │ 2022-07-31  TSLA      297.15
##    8 │ 2022-08-31  TSLA      275.61
##   ⋮  │     ⋮          ⋮        ⋮
##   18 │ 2022-06-30  NFLX      174.87
##   19 │ 2022-07-31  NFLX      224.9
##   20 │ 2022-08-31  NFLX      223.56
##   21 │ 2022-09-30  NFLX      235.44
##   22 │ 2022-10-31  NFLX      291.88
##   23 │ 2022-11-30  NFLX      305.53
##   24 │ 2022-12-31  NFLX      291.12
##                       9 rows omitted
Plotting
Plotting with Plots.jl
- I’m similar to base plot in R, matplotlib in Python
- I’m way better than Python,
- and similar to R
Plots.plot(1:10, 1:10, label = "Stock Price", linewidth = 2, title = "Stock Price");
Plots.plot!(xlabel = "Date");
Plots.plot!(ylabel = "Price")

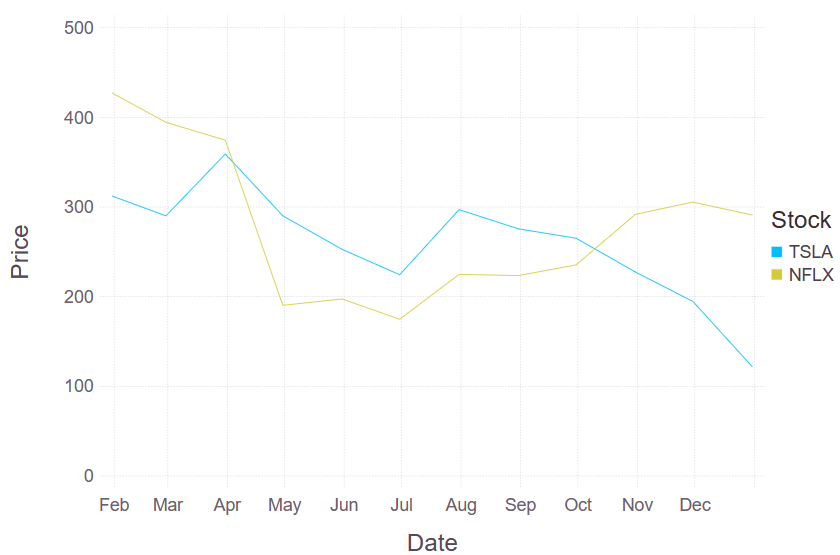
Plotting with Gadfly.jl
- I’m similar to ggplot2 in R
- not similar to anything in Python. Python never succeeded in plotting.
- I’m way way way better than Python,
- but less sophisticated than R.
- I know R is by far the best in Plotting,
- but I’m doing my best to catch it.
Gadfly.plot(stockPrices, x=:Date, y=:Price, Geom.line, color = :Stock)
## Plot(...)
Check this out to learn why I was created in the first place: